数据可视化:在 React 项目中使用 Vega 图表 (二)
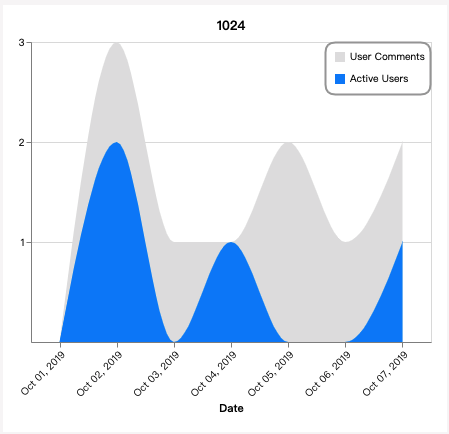
上一篇讲了如何在 React 项目中用 Vega-Lite 绘制基本的 area chart 图表。
本篇将介绍如何绘制多层图表,如何添加图例。
多层图表
通过上一篇文章,我们知道了可以通过 mark, encoding 等来描述我们想要的图表。要实现多层图表,只需要把多个包含上述属性的图表对象放进 layer 数组中就可以。就像栈一样, 从栈顶压入,后压入的(index 大的)图层在上层。
我们在之前的数据中加入用户评论数量 “user_comments”:
"data": {"values": [{ "user_comments": 0, "active_users": 0, "date": "2019-10-01" },{ "user_comments": 3, "active_users": 2, "date": "2019-10-02" },{ "user_comments": 1, "active_users": 0, "date": "2019-10-03" },{ "user_comments": 1, "active_users": 1, "date": "2019-10-04" },{ "user_comments": 2, "active_users": 0, "date": "2019-10-05" },{ "user_comments": 1, "active_users": 0, "date": "2019-10-06" },{ "user_comments": 2, "active_users": 1, "date": "2019-10-07" }]},
按照与上篇文章案例相同的 Vega-Lite 语法,写一个描述 user_comments 的单层图表。
其实只需要替换部分 y 轴的信息即可。
{"mark": {"type": "area", "color": "#e0e0e0", "interpolate": "monotone"},"encoding": {"x":{"field": "date","type": "ordinal","timeUnit": "yearmonthdate","axis": {"title": "Date", "labelAngle": -45}},"y": {"field": "user_comments","type": "quantitative","axis": {"title": "User Comments","format": "d","values": [1,2,3]}}}}
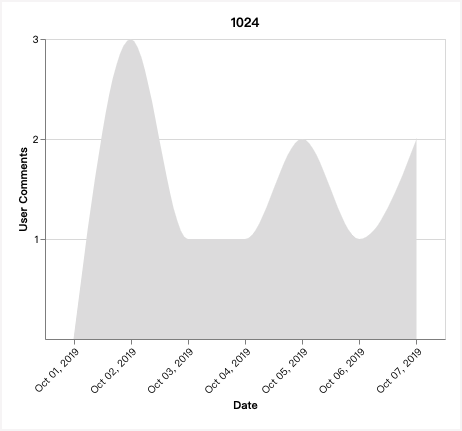
接下来,创建 layer 数组。把上述对象放入数组中,图表没有任何变化,此时仍然是单层图表。
..."layer":[{"mark": {"type": "area", "color": "#e0e0e0", "interpolate": "monotone"},"encoding": {"x":{"field": "date","type": "ordinal","timeUnit": "yearmonthdate","axis": {"title": "Date", "labelAngle": -45}},"y": {"field": "user_comments","type": "quantitative","axis": {"title": "User Comments","format": "d","values": [1,2,3]}}}}],...
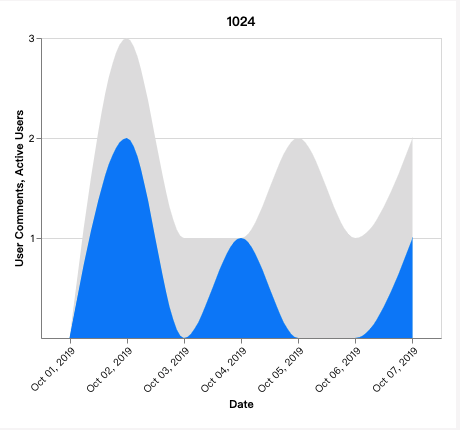
把上一篇中 Active Users 的对象加入数组,列在 User Comments 之后:
"layer":[{"mark": {"type": "area", "color": "#e0e0e0", "interpolate": "monotone"},"encoding": {"x":{"field": "date","type": "ordinal","timeUnit": "yearmonthdate","axis": {"title": "Date", "labelAngle": -45}},"y": {"field": "user_comments","type": "quantitative","axis": {"title": "User Comments","format": "d","values": [1,2,3]}}}},{"mark": {"type": "area", "color": "#0084FF", "interpolate": "monotone"},"encoding": {"x": {"field": "date","type": "ordinal","timeUnit": "yearmonthdate","axis": {"title": "Date", "labelAngle": -45}},"y": {"field": "active_users","type": "quantitative","axis": {"title": "Active Users","format": "d","values": [1,2]}}}}],
当当~ 多层图表出现了。
增加图例
与之前的图表相比,横轴没什么变化,竖轴的位置显示了两层图表的 title。但这样表意不够清晰,用户不能一眼看明白哪个颜色代表哪个数据。所以我们需要引进图例(legend)。
创建图例的方式并不唯一,我通过 stroke 创建图例,用 legend 来优化它的样式。
在任一图层中加入 stroke:
...{"mark": {"type": "area", "color": "#e0e0e0", "interpolate": "monotone"},"encoding": {"x":{"field": "date","type": "ordinal","timeUnit": "yearmonthdate","axis": {"title": "Date", "labelAngle": -45}},"y": {"field": "user_comments","type": "quantitative","axis": {"title": "User Comments","format": "d","values": [1,2,3]}},"stroke": {"field": "symbol","type": "ordinal","scale": {"domain": ["User Comments", "Active Users"],"range": ["#e0e0e0", "#0084FF"]}}}},...
图中出现了丑丑的图例:
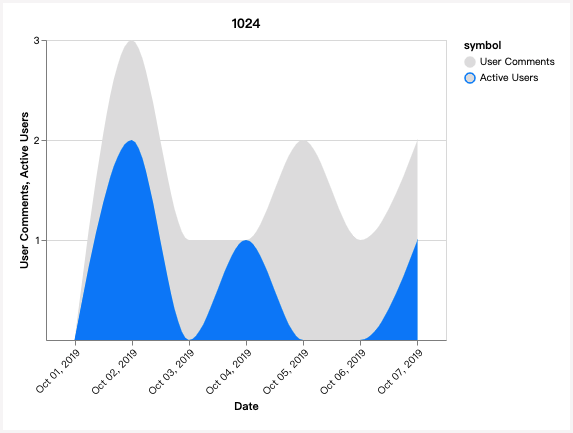
化妆师 legend 登场,赶紧打扮一下。在顶层的 config 中添加 legend 对象:
..."legend": {"offset": -106, // 调节图例整体水平移动距离"title": null,"padding": 5,"strokeColor": "#9e9e9e","strokeWidth": 2,"symbolType": "stroke","symbolOffset": 0,"symbolStrokeWidth": 10,"labelOffset": 0,"cornerRadius": 10,"symbolSize": 100,"clipHeight": 20}
现在顺眼多啦!
其实现在不要竖轴的 title 都可以,将 y.axis 对象的 title 删除或置空即可,效果如文章首图。
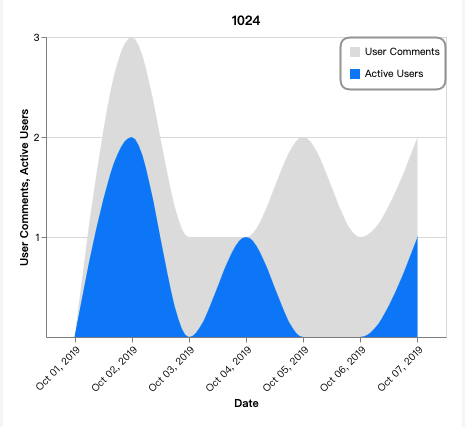
当图层多的时候,也可以搭配使用 area chart 和 line chart,效果也不错,只需要把该图层的 mark.type 改为 line 即可。
示意图: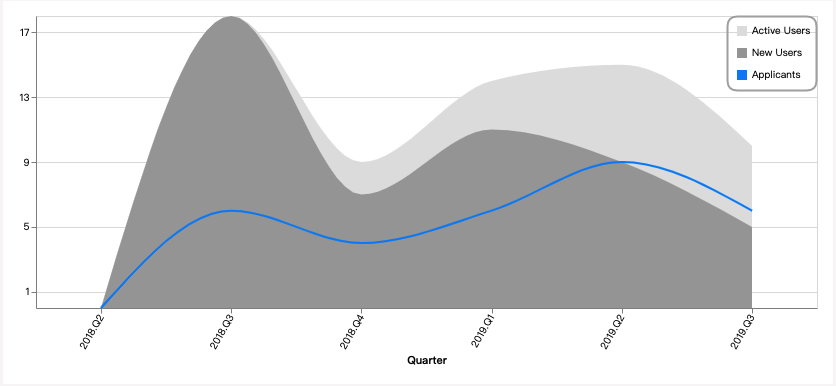
在 React 项目中使用
import React from 'react';import { Vega } from 'react-vega';// chart configconst jobpalBlue = '#e0e0e0';const jobpalLightGrey = '#0084FF';const jobpalDarkGrey = '#9e9e9e';const areaMark = {type: 'area',color: jobpalBlue,interpolate: 'monotone',};const getDateXObj = rangeLen => ({field: 'date',type: `${rangeLen > 30 ? 'temporal' : 'ordinal'}`,timeUnit: 'yearmonthdate',axis: {title: 'Date',labelAngle: -45,},});const getQuantitativeYObj = (field, title, values) => ({field,type: 'quantitative',axis: {title,format: 'd',values,},});const legendConfig = {title: null,offset: -106,padding: 5,strokeColor: jobpalDarkGrey,strokeWidth: 2,symbolType: 'stroke',symbolOffset: 0,symbolStrokeWidth: 10,labelOffset: 0,cornerRadius: 10,symbolSize: 100,clipHeight: 20,};const getSpec = (yAxisValues = [], rangeLen = 0) => ({$schema: 'https://vega.github.io/schema/vega-lite/v4.json',title: 'Demo Chart',layer: [{mark: {...areaMark,color: jobpalLightGrey,},encoding: {x: getDateXObj(rangeLen),y: getQuantitativeYObj('user_comments', '', yAxisValues),stroke: {field: 'symbol',type: 'ordinal',scale: {domain: ['User Comments', 'Active Users'],range: [jobpalLightGrey, jobpalBlue],},},},}, {mark: areaMark,encoding: {x: getDateXObj(rangeLen),y: getQuantitativeYObj('active_users', '', yAxisValues),},},],config: {legend: legendConfig,},})const data = [{ "user_comments": 0, "active_users": 0, "date": "2019-10-01" },{ "user_comments": 3, "active_users": 2, "date": "2019-10-02" },{ "user_comments": 1, "active_users": 0, "date": "2019-10-03" },{ "user_comments": 1, "active_users": 1, "date": "2019-10-04" },{ "user_comments": 2, "active_users": 0, "date": "2019-10-05" },{ "user_comments": 1, "active_users": 0, "date": "2019-10-06" },{ "user_comments": 2, "active_users": 1, "date": "2019-10-07" }]const App = () => {// get max value from data araryconst yAxisMaxValueFor = (...keys) => {const maxList = keys.map(key => data.reduce(// find the item containing the max value(acc, cur) => (cur[key] > acc[key] ? cur : acc))[key]);return Math.max(...maxList);};const yAxisValues = Array.from({ length: yAxisMaxValueFor('active_users', 'user_comments') },).map((v, i) => (i + 1));const spec = getSpec(yAxisValues, data.length);return (<div className="App"><Vegaspec={{...spec,autosize: 'fit',resize: true,contains: 'padding',width: 400,height: 300,data: { values: data },}}actions={{export: true,source: false,compiled: false,editor: false,}}downloadFileName={'Just Name It'}/></div>);}export default App;
resize
在实际项目中,我们必须保证图表大小能跟随窗口大小变化。接下来,我们来实现这个功能。
图表在绘制完成后不会重新绘制,但我们可以通过 React 组件接管宽高值来实现重新绘制。
即:
- 在
state中管理width和height - 通过
setState刷新来实现图表的重绘 - 在生命周期方法中设置事件监听函数来监听
resize事件 - 结合 css 和
ref, 通过图表外的 warper 层得到此时图表正确的宽高值
示例代码如下:
import React from 'react';import { Vega } from 'react-vega';// chart configconst jobpalBlue = '#e0e0e0';const jobpalLightGrey = '#0084FF';const jobpalDarkGrey = '#9e9e9e';const areaMark = {type: 'area',color: jobpalBlue,interpolate: 'monotone',};const getDateXObj = rangeLen => ({field: 'date',type: `${rangeLen > 30 ? 'temporal' : 'ordinal'}`,timeUnit: 'yearmonthdate',axis: {title: 'Date',labelAngle: -45,},});const getQuantitativeYObj = (field, title, values) => ({field,type: 'quantitative',axis: {title,format: 'd',values,},});const legendConfig = {title: null,offset: -106,padding: 5,strokeColor: jobpalDarkGrey,strokeWidth: 2,symbolType: 'stroke',symbolOffset: 0,symbolStrokeWidth: 10,labelOffset: 0,cornerRadius: 10,symbolSize: 100,clipHeight: 20,};const getSpec = (yAxisValues = [], rangeLen = 0) => ({$schema: 'https://vega.github.io/schema/vega-lite/v4.json',title: 'Demo Chart',layer: [{mark: {...areaMark,color: jobpalLightGrey,},encoding: {x: getDateXObj(rangeLen),y: getQuantitativeYObj('user_comments', '', yAxisValues),stroke: {field: 'symbol',type: 'ordinal',scale: {domain: ['User Comments', 'Active Users'],range: [jobpalLightGrey, jobpalBlue],},},},}, {mark: areaMark,encoding: {x: getDateXObj(rangeLen),y: getQuantitativeYObj('active_users', '', yAxisValues),},},],config: {legend: legendConfig,},})const data = [{ "user_comments": 0, "active_users": 0, "date": "2019-10-01" },{ "user_comments": 3, "active_users": 2, "date": "2019-10-02" },{ "user_comments": 1, "active_users": 0, "date": "2019-10-03" },{ "user_comments": 1, "active_users": 1, "date": "2019-10-04" },{ "user_comments": 2, "active_users": 0, "date": "2019-10-05" },{ "user_comments": 1, "active_users": 0, "date": "2019-10-06" },{ "user_comments": 2, "active_users": 1, "date": "2019-10-07" }];// get max value from data araryconst yAxisMaxValueFor = (...keys) => {const maxList = keys.map(key => data.reduce(// find the item containing the max value(acc, cur) => (cur[key] > acc[key] ? cur : acc))[key]);return Math.max(...maxList);};const { addEventListener, removeEventListener } = window;class App extends React.Component {state = {width: 400,height: 300,}componentDidMount() {addEventListener('resize', this.resizeListener, { passive: true, capture: false });}componentWillUnmount() {removeEventListener('resize', this.resizeListener, { passive: true, capture: false });}resizeListener = () => {if (!this.chartWrapper) return;const child = this.chartWrapper.querySelector('div');child.style.display = 'none';const {clientWidth,clientHeight: height,} = this.chartWrapper;const width = clientWidth - 40; // as padding: "0 20px"this.setState({ width, height });child.style.display = 'block';}refChartWrapper = el => {this.chartWrapper = elif (el) this.resizeListener();}yAxisValues = Array.from({ length: yAxisMaxValueFor('active_users', 'user_comments') },).map((v, i) => (i + 1));render() {const {width, height, yAxisValues} = this.state;const spec = getSpec(yAxisValues, data.length);return (<divref={this.refChartWrapper}style={{ margin: '10vh 10vw', width: '80vw', height: '50vh' }}><Vegaspec={{...spec,autosize: 'fit',resize: true,contains: 'padding',width,height,data: { values: data },}}actions={{export: true,source: false,compiled: false,editor: false,}}downloadFileName={'Just Name It'}/></div>);}}export default App;
动图演示: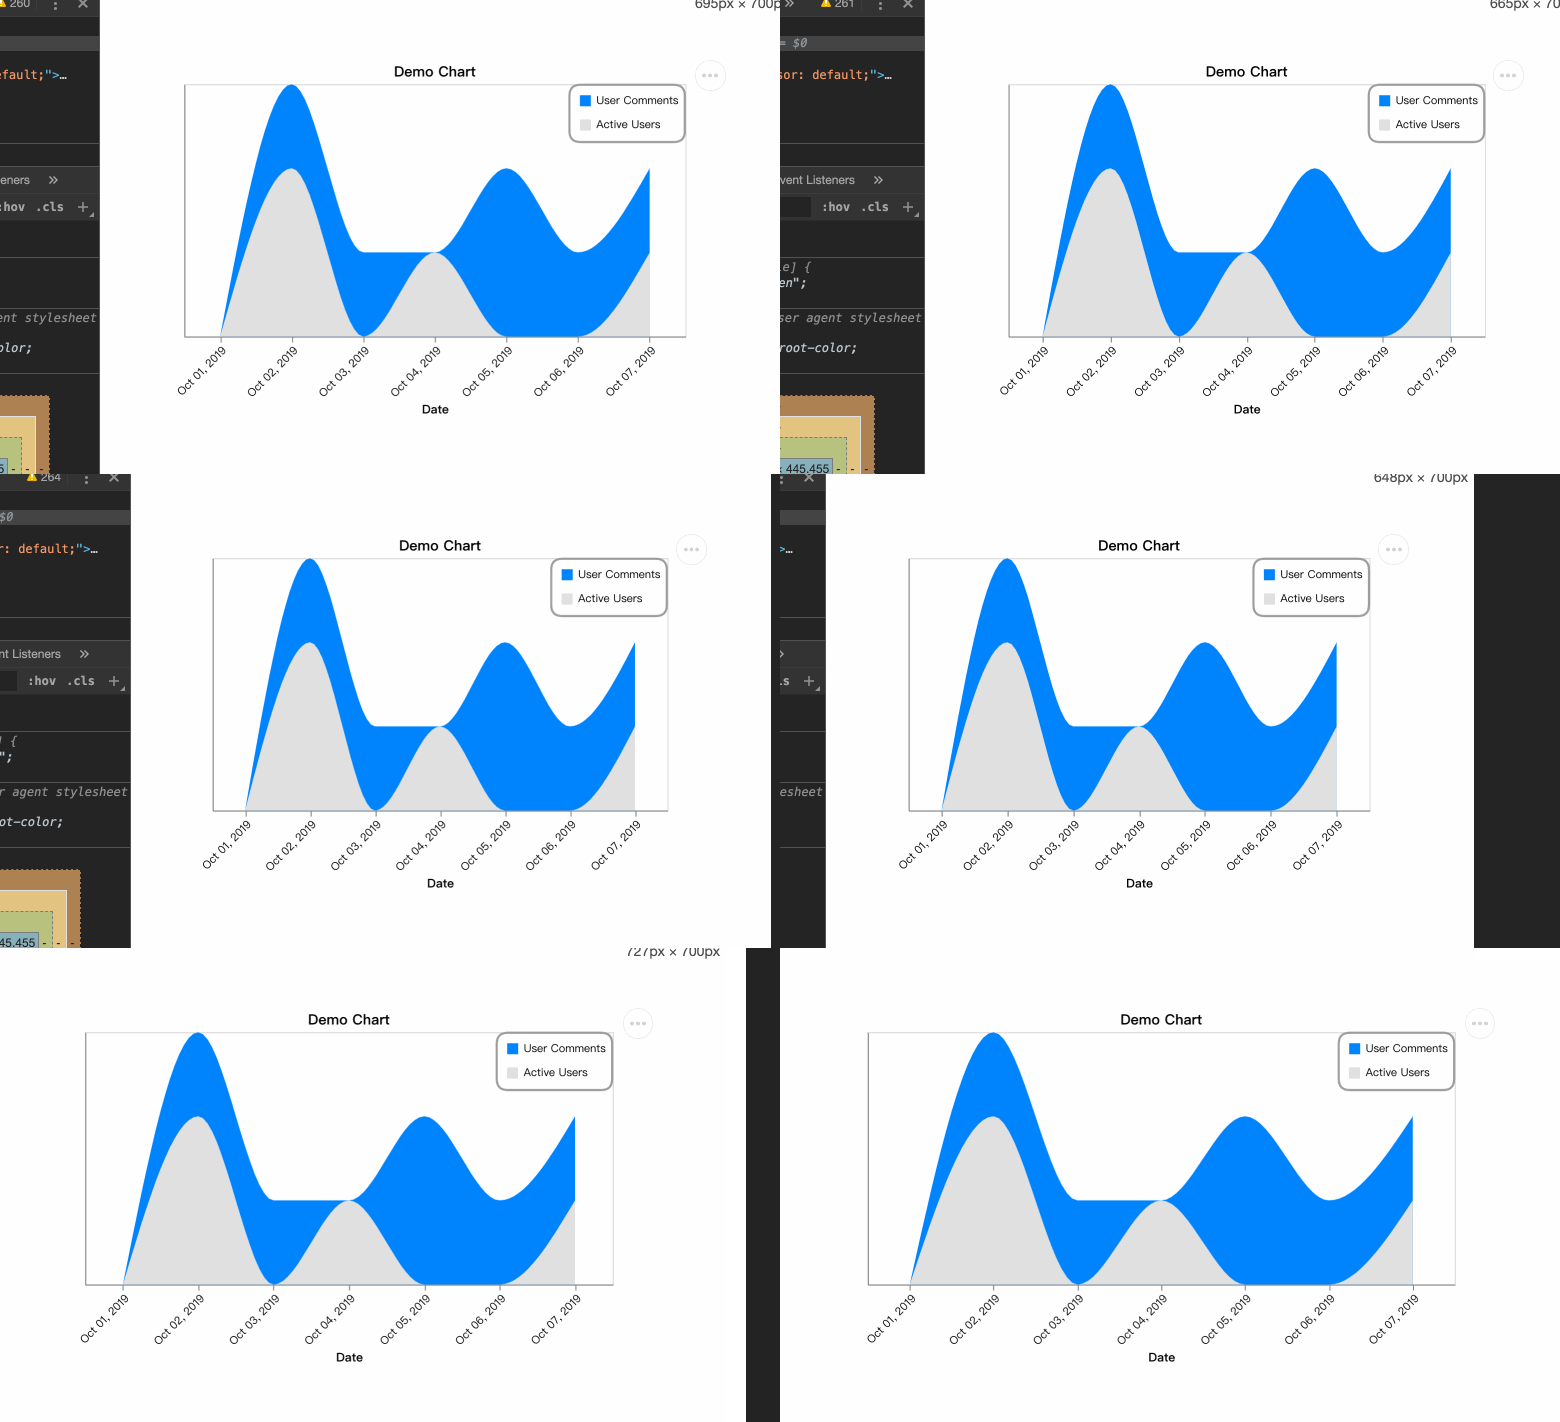
至此,图表已经基本完善。







还没有评论,来说两句吧...